Most Americans Do Not Have Enough to Retire
RELAB POLICY NOTE
(854 KB)
This policy note is part of SCEPA’s “Tracking the Retirement Crisis” series. This series was made possible in part through the generous support of The James Family Charitable Foundation and the Social Security Administration (RDRC23000009-01-00 and RDRC23000009-02-00). We are deeply grateful for their commitment to supporting our work and advancing research in this field.
Elevator Pitch: Most Americans are not on track for a secure retirement, and the numbers show it. Only about 35% of people approaching retirement say they feel “on track.” About half of Americans ages 62–74 cannot count on even $25,000 per person per year – barely enough to cover basic expenses. International comparisons are even starker: the U.S. elder poverty rate is about 23%, versus roughly 12% in Canada, 4–5% in France, and 3% in the Netherlands.
Boston College’s National Retirement Risk Index shows that 39% of working-age households are at risk of seeing their standard of living fall in retirement. Aon estimates that households need private retirement savings equal to about 11.1 times their annual spending – on top of Social Security – yet typical midlife workers have only a small fraction of that, translating to just a few hundred dollars a month in retirement income. The solution isn’t more do-it-yourself 401(k)s, but a stronger Social Security system paired with universal Guaranteed Retirement Accounts.
The US Falls Short on All Measures of Retirement Readiness
Will I have enough to live on in retirement? Almost everyone wants to know. The Federal Reserve reports that confidence is fragile: only about two - thirds of people approaching retirement feel on track.1
Retirement “confidence” surveys are abundant – new ones seem to appear every week – but their results depend heavily on who is surveyed. Across the board, though, they reveal significant anxiety and a sense of financial fragility that closely follow labor-market and class lines: whether someone has a 401(k), works full time, and earns a high or low income.2
According to the Economic Innovation Group, more than 78 percent of full-time workers earning under $27,400 a year lack access to any retirement plan, compared with just 18 percent of those earning over $180,600.3
There are three main ways to gauge your – or a population’s – retirement readiness, and no matter which measure we use, the United States is falling short.
- Will I have enough to meet my basic needs?
- Will I have enough to avoid being poor or near-poor?
- Will I have enough income compared to my working life to maintain my pre-retirement standard of living?
People may need slightly less income in retirement because taxes will likely be lower (no Social Security payroll tax) and they no longer need to save a portion of their earnings for retirement.
But your cost of living may rise, especially if you shift from living as a couple to living alone or if your healthcare needs increase. The poorer you are before retirement, the more relevant the first two measures of retirement success – covering basic needs and avoiding poverty – become. The third measure, maintaining your pre-retirement standard of living, matters less when that standard was already too low to aspire to. The working poor do not dream of becoming the retired poor, and our social goals should reject that outcome as well.
Therefore, the measure of retirement security success will differ depending on where you sit. Upper-middle-class households want to stay upper-middle-class into retirement and may not worry as much about meeting absolute basic needs or falling into poverty, while many other households are fighting simply not to fall into deprivation.
Staying Above the Poverty Line
For many people, simply staying above poverty is the most realistic retirement goal. Many Americans ages 62–70 have retirement resources that would keep them only just above the official U.S. poverty line. Strikingly, savings are so low that half of Americans ages 62–74 have less than $25,000 per person per year—roughly the U.S. poverty threshold and far below the international benchmark of 50% of national median income (about $42,000). For comparison, the official 2025 U.S. poverty guideline for a single-person household was $15,650.
According to the U.S. Census Bureau, median household income in 2024 was $83,730, placing the 50-percent-of-median relative-poverty threshold at $41,865. According to international standards the elder poverty rate in Canada is around 15%, France and the Netherlands about 6%.4 The United States has the highest elder poverty rates among the highest income and large OECD nations at 23%.
The official poverty level in the U.S is tied to the cheapest cost of 2,000 calories a day, multiplied by three to cover basic shelter and clothing. It is meant to maintain life for a short period, not a sustainable existence. In 2025, the federal poverty level was $15,650 for a single individual and $21,150 for a couple.5 Surviving on this at any time in life is difficult, and it is even more difficult in old age when health becomes more fragile, and costs increase.
In 2023, households in the lowest income quintile spent an average of one - third of their after-tax income on food.6 For someone living on $24,000 per year, that amounts to roughly $123 per week – about $17.50 per day – for food. By comparison, the highest-income households spent about 8% of their after-tax income on food – about $47 per day.
The Elder Index Measures Shortfall to Meet Basic Needs
The Elder Index, created by researchers at the University of Massachusetts Boston’s Gerontology Institute, calculates Economic Insecurity Rates (EIRs): the percentage of independent adults age 65 or older with annual incomes that do not support economic security.7
National averages suggest that 48% of older adults living alone and 21% of older couples have annual incomes below the Elder Index value.8 In every state, more than one-third of older singles are at risk of being unable to afford basic needs and to age in their own homes.
And economic insecurity is not evenly distributed: 50% of White households were at risk of not being able to afford basic living expenses in their local areas, while the share of those at risk increased to 61% for Asian households, 66% for Black households, and 74% for Latino/Hispanic households.9
Staying in Your Class
Boston College’s Center for Retirement Research uses a “maintain living standards” approach. The best gauge of how well households are doing on this front is the Center’s National Retirement Risk Index (NRRI), based on the Federal Reserve’s Survey of Consumer Finances.10 In 2022, the NRRI showed that 39% of today’s working-age households will not be able to maintain their standard of living in retirement. That number may be artificially low because rising home prices, pandemic-era savings, and strong stock market gains temporarily inflated readiness measures. As these factors fade, the Index will likely revert to finding that the share of households nearing retirement age who are financially prepared for retirement fluctuates between 40% and 50%.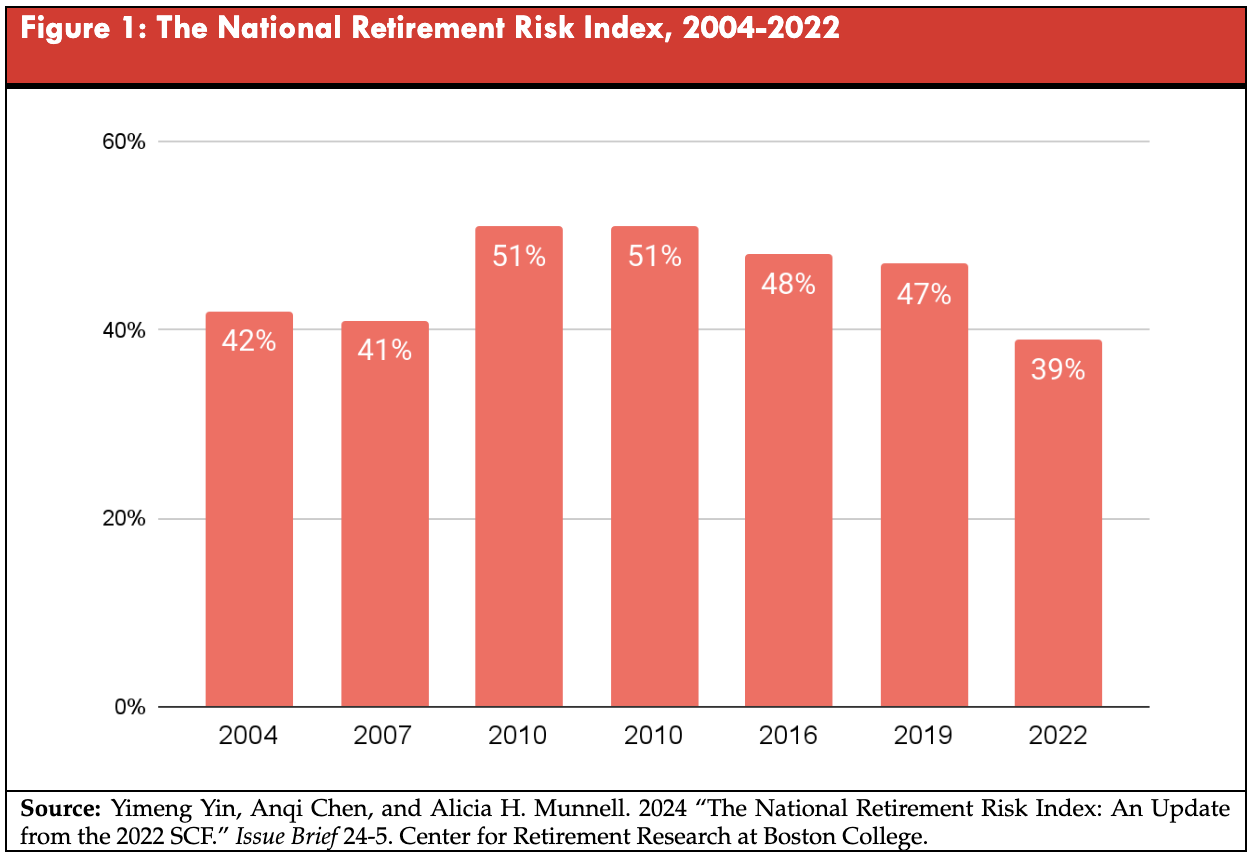
Aon’s Real Deal framework offers a compact benchmark for the ability to stay in your class.11 It estimates that, to sustain one’s standard of living from age 67 through roughly age 90, a household needs private assets equal to about 11.1 times final annual spending at age 67, in addition to Social Security. Under that same framework, being “on track” by age 55 means holding private assets of about 7 times annual spending, assuming uninterrupted work and continued accumulation through age 67.
Aon pairs this benchmark with a recommended savings path: workers who start saving about 16% of their pay at age 25 (including employer contributions) can reach the target by their early 60s. In reality, however, typical contribution rates – among the roughly half of employees who save at all – are much lower, around 4–7%. This leaves a substantial gap between actual savings and what the benchmark requires.
Here is an illustration of how to use this rule of thumb. Let’s say your goal is to spend $100,000 per year from private (non-Social Security) wealth starting at age 67. So that the on-track checkpoint at age 55 would be $700,000 in private financial assets targeted for retirement assets (about 7 times targeted annual spending).
Crucially, being on track means that one expects to keep on working and accumulating until age 67. That means if everything goes right in your health and employment by age 67 you had $1,000,000 in private assets (about 10x; Aon’s goal is 11.1x, with the exact multiple depending on return, mortality, and withdrawal assumptions).
These Aon checkpoints are optimistic because they assume a person meets several strict conditions:
- No pre-retirement withdrawals – complete “no leakage.”
- Stable market returns after fees – for example, a balanced 60/40 portfolio earned about 7.6% annually between 2016 and 2020.
- Continuous employment and steady contributions of 6–8% per year all the way to age 67.
Fewer than one in ten older workers meet all of these requirements, which makes the benchmarks more idealized than realistic.12
We did a reality check by looking at what people need in retirement wealth to be on track to maintain their living standards into retirement. In 2016 (the latest total retirement wealth numbers from the Health and Retirement Survey), among adults ages 51–56, median private retirement wealth was about $55,000 – since average income according to the Census (Current Population Report) was about $50,000, the corresponding median retirement savings should have been $350,000.13
Private retirement wealth of $55,000 would support roughly $4,413 per year (about $368/month) of private-asset-financed spending in retirement, under the optimistic assumptions that the account earns 5%, lasts 20 years, and there are no pre-retirement withdrawals. Even under unrealistically optimistic assumptions, private retirement wealth payouts would be relatively small.
But note the median private retirement wealth distributional differences are stark (See Figure 2):14
- Bottom segment: $12,800 would yield about $1,207 per year ($100/month).
- Middle 40%: $152,000 would yield about $12,197 per year ($1,016/month).
- Top segment: $400,000 would yield about $32,092 per year ($2,674/month).
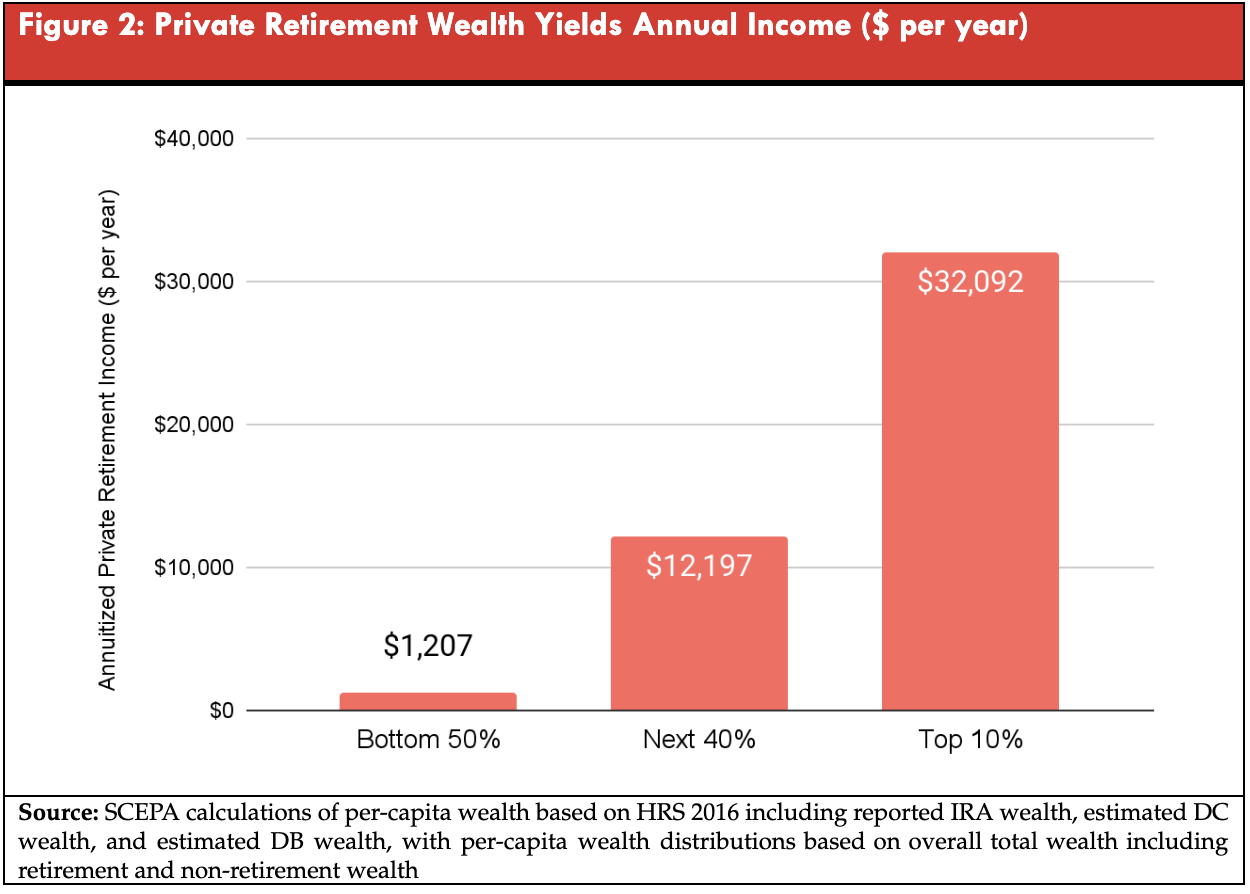
It’s important to note that these estimates ignore fees, taxes, and market volatility; once adjusted, actual withdrawals would be even lower. For people in the bottom half of the wealth distribution, private retirement savings add only about $100 a month on average. Even for middle-class households, average payouts are about $1,016 a month – less than the federal Census Bureau’s 2016 poverty threshold of $1,040 for a single person.15 In short, for nearly everyone, private retirement wealth provides only a modest supplement to public retirement benefits, not a reliable foundation.
Policy Recommendations
The solution to the retirement crisis is not to double down on defined-contribution plans and shift even more risk onto individuals. Social Security urgently needs additional revenue, because if Congress fails to act, the program will face an across-the-board benefit cut of about 21% in 2033 – a change that would likely trigger both a political crisis and a humanitarian disaster. 16 Social Security isn’t just for low-income workers – it is the core pension system for the U.S. middle class. Almost all Americans age 65 and older receive Social Security, and it provides about 31% of their total income. About 40% of men and 44% of women rely on Social Security for at least half of their income, and roughly 12% of men and 15% of women depend on it for 90% or more of what they live on. 17 Roughly one-fifth of Americans over age 65 are considered poor by international standards. Peer nations set their basic and minimum pensions high enough to keep almost all older adults above poverty. The U.S., as a wealthy country, could reasonably aim for the same outcome.Most of the additional revenue needed for Social Security could come from raising the earnings cap and broadening the tax base. Currently, only wages up to $176,100 are subject to Social Security taxes, meaning earnings above that amount – and all capital income – are exempt. Yet people earning above roughly $200,000 hold a disproportionate share of total wealth and capital income. 18
We need universal, secure, and portable retirement accounts – Guaranteed Retirement Accounts (GRAs). Every worker would be automatically enrolled, every employer would contribute, and the funds would be pooled and professionally managed to provide guaranteed lifetime income. GRAs would follow workers from job to job and supplement Social Security, not replace it.The closest current proposal to a system like the GRA is the Retirement Security for All Americans Act (RSAA) in Congress. The RSAA would automatically enroll all workers without a pension or 401(k) into a universal, portable, pooled retirement plan with guaranteed employer and employee contributions – providing a stable income stream in retirement.
References
Board of Governors of the Federal Reserve System. (2025, May). Economic well-being of U.S. households in 2024 (Results from the 2024 Survey of Household Economics and Decisionmaking).
Ghilarducci, T. and Manickam, K. (2024). “How Americans Feel About Their Retirement Prospects: Surveying the Surveys.” Policy Note Series, Schwartz Center for Economic Policy Analysis at The New School for Social Research. New York, NY.
This report shows retirement readiness is sharply stratified by income, with those at the top far more likely to save.
Eckhardt, S., & Glasner, B. (2024, October 3). Who’s left out of America’s retirement savings system?. Economic Innovation Group. https://eig.org/whos-left-out-of-americas-retirement-savings-system/
Organisation for Economic Co-operation and Development. (2024). Society at a glance 2024: OECD social indicators (Chapter 4: Income poverty). OECD Publishing. https://www.oecd.org/en/publications/society-at-a-glance-2024_918d8db3-en.html
https://www.oecd.org/en/data/indicators/poverty-rate.html
U.S. Census Bureau. (2025, September 9). Income in the United States: 2024 (Current Population Reports, P60-286). U.S. Department of Commerce. https://www.census.gov/library/publications/2025/demo/p60-286.html
U.S. Department of Health and Human Services, Office of the Assistant Secretary for Planning and Evaluation. (2025, January 17). 2025 Poverty Guidelines for the 48-Contiguous States and the District of Columbia. https://aspe.hhs.gov/sites/default/files/documents/dd73d4f00d8a819d10b2fdb70d254f7b/detailed-guidelines-2025.pdf
US Department of Health and Human Services. (2025). Poverty Guidelines. Office of the Assistant Secretary for Planning and Evaluation. Retrieved November 25, 2025, from http://aspe.hhs.gov/topics/poverty-economic-mobility/poverty-guidelines
U.S. Department of Agriculture Economic Research Service. (2023). Food expenditure patterns by income quintile. https://www.ers.usda.gov/data-products/chart-gallery/chart-detail?chartId=58372
Elder Index. (2024). The Elder Index™ [Public Dataset]. Boston, MA: Gerontology Institute, University of Massachusetts Boston. Retrieved from ElderIndex.org
Mutchler, Jan; Su, Yan-Jhu; and Velasco Roldan, Nidya, "Living Below the Line: Economic Insecurity and Older Americans, Insecurity in the States, 2022" (2023). Center for Social and Demographic Research on Aging Publications. 66. https://scholarworks.umb.edu/demographyofaging/66
Mutchler, Su, & Velasco Roldan, 2023).
Center for Retirement Research. (2022). National Retirement Risk Index: An update. Boston College
Aon Consulting. (2018). The real deal: 2018 retirement income adequacy study. Aon. https://www.aon.com/2018-retirement-income-adequacy-study-the-real-deal/index
Aon Consulting. (2018). The real deal: 2018 retirement income adequacy study. Aon. https://www.aon.com/2018-retirement-income-adequacy-study-the-real-deal/index
SCEPA calculations of per-capita wealth based on HRS 2016 including reported IRA wealth, estimated DC wealth, and estimated DB wealth
SCEPA calculations of per-capita wealth based on HRS 2016 including reported IRA wealth, estimated DC wealth, and estimated DB wealth, with per-capita wealth distributions based on overall total wealth including retirement and non-retirement wealth
Semega, Jessica L., Kayla R. Fontenot, and Melissa A. Kollar, U.S. Census Bureau, Current Population Reports, P60-259, Income and Poverty in the United States: 2016, U.S. Government Printing Office, Washington, DC, 2017.
Social Security Administration. (2025, June 20). Social Security Board of Trustees: Projection for combined trust funds one year sooner than last year. Social Security Matters blog. https://www.ssa.gov/blog/social-security-trustees-report-2025/
Social Security Administration. (2025, February). Social Security fact sheet. SSA. https://www.ssa.gov/news/press/factsheets/basicfact-alt.pdf
Congressional Research Service. (2023). Income for the population ages 65 and older: Evidence from the Health and Retirement Study (HRS) (CRS Report R47341). Library of Congress. https://www.congress.gov/crs-reports/
Board of Trustees, Federal Old-Age and Survivors Insurance and Federal Disability Insurance Trust Funds. (2024, May 6). The 2024 annual report of the Board of Trustees of the Federal Old-Age and Survivors Insurance and Federal Disability Insurance Trust Funds. Social Security Administration. https://www.ssa.gov/oact/tr/2024/tr2024.pdf
Suggested Citation: Ghilarducci, T. (2025). “Are Older Workers A New Reserve Army of Labor?.” Tracking the Retirement Crisis Policy Note Series. Schwartz Center for Economic Policy Analysis at The New School for Social Research. New York, NY.